Hi All,
On 28 Apr 2020, I spoke on the Power BI SQL PASS community event.
Meetup Event: SG SQL PASS Chapter Meetup - April 2020
Slide Deck and resources (Excel and sample PBIX files)
There are 4 key pillars of Power BI Solution:

I hope you enjoyed this blog-post.
On 28 Apr 2020, I spoke on the Power BI SQL PASS community event.
Meetup Event: SG SQL PASS Chapter Meetup - April 2020
Slide Deck and resources (Excel and sample PBIX files)
There are 4 key pillars of Power BI Solution:

- Transform Data
- Our data will be always raw data that needs to massing for the reports.
- Data has to into shape and we need to perform a couple of data transformations.
- Power BI tries to attempt data types during data transformations. But it may not correct.
- Data Modelling
- In this phase, we optimizing the tables and columns.
- Segmenting common dimensions of your data & build relationships between tables.
- Having an effective data model saves so much time
- DAX calculations
- Formula language that is used in Power BI.
- Not only used by PBI but other Microsoft Products.
- The primary tool to build Power BI solutions
- Report & Visuals
- This MUST be the last step. You skip the above 3 steps, your BI solutions won't be a success.
- More time should be spent on the data model and DAX.
- Use appropriate chart / visual for data & STORY you are telling
- Key Information STAND OUT
- Clear & simple title / headings.
- Understand within 15-20 seconds


In this blog post, we will see how to use a sample excel file which can be treated as RAW DATA which as follows data
- Sales - Fact Table
- It is a transactional table with 7000+ rows.
- It has columns such as OrderNumber, OrderDate, Customer Information, Currency, Delivery Information, etc.
- US Region - Lookup Table
- Information about all US regions
- Customer List - Lookup Table
- Information about all customer and Distribution channel.
- Product List - Lookup Table
- Information about Products


Customer requirements from this report
- KPIs for
- Total Sales.
- The number of units sold
- The number unique Order.
- Average Sales per day
- Charts about
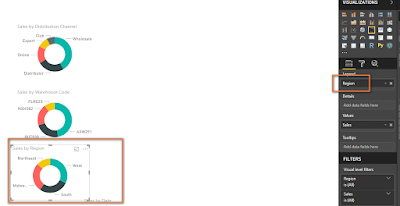
- Sales by the Distribution Channel
- Sales by the Warehouse code
- Sales by Region
- Sales bu date
- Country Map
- Sales by regions
We use this Excel file and open Power BI.
Follow the video where I have how to perform data clean up and data model.
I will show the DAX and Visual in this blogpost.
- Create a simple textbox Reporting canvas

- We create a table to store all our DAX formulas. Select Enter Data in the Report

- Name this Empty Table as Key Measure

- In this empty table create a new measure

- Name this 1st measure as Sales
Sales = SUM( Sales[LineTotal] )

- We have created the Date table that I have explained in my video.
- Drag
the Date table.

- Change from Date Hierarchy


- Change
to Matrix Visual

- Drag the Sales in Power BI
Desktop

- Change Visual to Stacked Column Chart.

- Drag
the Sales Measure and convert it into card visual.

- Drag
DistributionChannel from consumer
list.

- in
our Data model, we have a relationship
with the Sales and Consumer table.
We can still get DistributionChannel as it is part of the relationship.
- Drag
Sales Measure in this table.

- Convert
to visual to a donut chart.

- Copy
paste this visual twice. It really
quickens the report development.

- 2nd donut chart drag Warehouse code

- 3rd donut chart drag Region code
- Drag
Map visual and Name field from US Region

DAX Calculations - Create a 2nd measure called Unit Sold.
Units Sold = SUM(Sales[OrderQuantity])
Make it as a Card Visual
- Copy
paste that card visual twice

- Create 3rd measure called Unique Order
Unique Order = COUNTROWS(Sales)
The numbers will change when you any visuals.
- Create the last and 4th measure called Average Sales Per Day
Average Sales Per Day = AVERAGEX('Date', [Sales]) - Adding Year's slicers.

Add Year slicer.


I hope you enjoyed this blog-post.
--aaroh


No comments:
Post a Comment