Hi All,
On 20 March 2020, Cochin PowerApps and Power Automate User Group and talked about how to use Microsoft Forms and Power Automate we can easily use Power BI Real-time data sets.
The event link: Power Meet Vol.1
Slide Deck: https://1drv.ms/b/s!Agzu64nn_swcg5FVJK4-5UVS71yqKQ?e=2W3vl3
What is required is as follows:
1. An Office 365 free 30-days trial or subscription.
2. Microsoft Forms
3. Power Automate
4. Power BI Free or Pro edition.

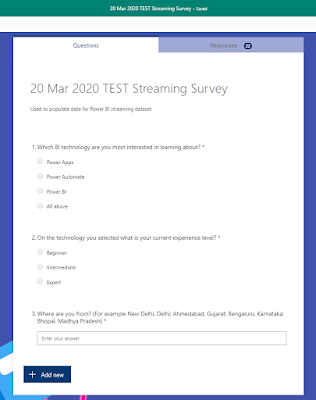
Contoso Inc wants to hold an event and sends 1000 participants a simple digital survey. They ask about 3 questions
Contoso wants the REAL-TIME dashboard whenever any participant submits the survey. Specifically, Contoso wants the COUNTRY they are from, and participants their number of EXPERIENCE.
This is a sample of our Microsoft Form
We will cover 2 demos here.
How to use Twitter Sentiment Analysis with Power Automate's ready-made template and display on Power BI real-time datasets
On 20 March 2020, Cochin PowerApps and Power Automate User Group and talked about how to use Microsoft Forms and Power Automate we can easily use Power BI Real-time data sets.
The event link: Power Meet Vol.1
Slide Deck: https://1drv.ms/b/s!Agzu64nn_swcg5FVJK4-5UVS71yqKQ?e=2W3vl3
What is required is as follows:
1. An Office 365 free 30-days trial or subscription.
2. Microsoft Forms
3. Power Automate
4. Power BI Free or Pro edition.
What are Power BI Streaming Datasets
Streaming/Real-time datasets give users the capability to stream data and update dashboards in real-time. This can be from various different sources like social media, sensors, IoT devices, etc.
Types of Real-Time Datasets
There are 3 types of real-time datasets.
- Push Datasets
- Stream Datasets
- PubNub Datasets
Streaming dataset matrix
The following table (or matrix, if you like) describes the three types of datasets for real-time streaming and lists the capabilities and limitations of each.

For our demo examples, we will use Push dataset to do following benefits
- Database Created
- Reports can be created
- Any visuals
- Real-Time in Dashboards
- Cannot use Pin Live Page
- Maintains History
- Q and A Works Well
What is our Business scenario?
Contoso Inc wants to hold an event and sends 1000 participants a simple digital survey. They ask about 3 questions
- What Microsoft TECHNOLOGY they are interested in,
- the number of years of EXPERIENCE they have in that technology and
- the LOCATION they are from.
Contoso wants the REAL-TIME dashboard whenever any participant submits the survey. Specifically, Contoso wants the COUNTRY they are from, and participants their number of EXPERIENCE.
The technology we can use to achieve this requirement
We can use MICROSOFT FORM to capture digital form. The Microsoft Flow which will process our questions in the Microsoft flow. Next, we can use set up the Power BI Push dataset and use Power Visuals to achieve this.This is a sample of our Microsoft Form

We will cover 2 demos here.
Demo1:
How to use Microsoft Forms with Power Automate from scratch to display the real-time data on Power BI Dashboard.
Demo2:
How to use Twitter Sentiment Analysis with Power Automate's ready-made template and display on Power BI real-time datasets
Demo1: Steps by Step
STEP 1: Setup Power Automate
- Go to https://flow.microsoft.com
- Create an Instant - From blank

- Click on Skip on next screen

- We
will choose Microsoft Forms as our Trigger in the Flow.

- It will limit the number of actions and trigger which are available to our disposal.
- We
have only ONE trigger which is nice. Click on “When a new response is submitted”.

- Please note that I have Single Sign-on (SSO) turned on.

- You will be presented with Form ID. Choose the Form which I have created.

and the response ID will be an array of 3 questions we have created.


- STEP 2: Setup Streaming Dataset in Power BI
- Go
to PowerBI.com

- Create a new app workplace and workspace a description name

- This
is the landing page. Click on the Skip


- Power
BI Workspace created.

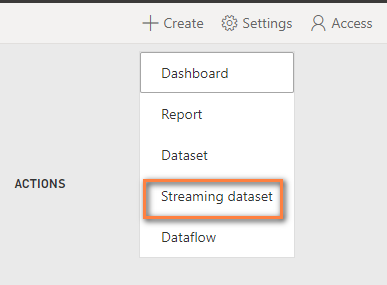
- Click
on Create option and then click on Streaming dataset.
- We
will leverage API and click NEXT

- Now
it has Power BI has a very intuitive user interface (UI) which just
enter the values. Types the values as follows:
Technology (as Text data type)
Experience (as Text data type)
Location (as Text data type)
Toggle ON for Historical data analysis
- Click on Done button

- A new dataset has been created and Power
BI Visuals have been created. It has the same look and feels just like your Power BI Desktop.

- Firstly, we will create a table visual here.

Drag all the fields to the table
Technology
Experience
Location
Bump the Grid size, Style and Total field


- Drag
the MAP visual and alight towards the top
right.

Drag the Location field onto the Location property of the map.
Drag the Technology field onto the Legend property of the map.
And finally, drag the Experience field onto Size property of the map.
- The last chart is a stacked column
chart and drags it to report canvas.

Drag Technology onto Axis property, Experience onto Legend property and Value onto Experience property
- Save the report as 20
Mar 2020 Survey Response

- The Reports are shown for this
workspace

- Next,
pin the visuals Individually

 Do the same for TWO more visuals.

- Now,
our Dashboard is ready.

- Note
that Streaming and Pubnub work only for custom streaming data and we can’t use ANY of the visual that we are doing for this example. as shown.


STEP 3: Complete the Power Automate
- Click on Add an action in Power Automate.
- Next,
Add rows to a data action

- Choose
appropriate workspace

- Select
the Dataset

- The table will be RealTimeData.

- Next,
Power Automate dynamically shows the Forms
data fields.

- Click
on SAVE button on the Power Automate

and you will see the Run History when people are submitting the Microsoft form data.


STEP4: View the Power BI Real-time Dashboard
- Dashboard display real-time
data when anyone submits a form.

- The report can be refreshed by using a Schedule.


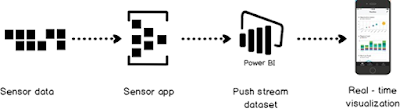
In real-time scenarios, we can use an IoT device to check sensor data that goes to Power BI's Push steam dataset and users can view it on their mobile device

In this next business scenario, we want to check the sentiment analysis using Power Automate's Twitter template and check what people think about a specific product or service.


Demo2: Steps by Step
STEP 1: Create a Data Set in Power BI service
- Navigate to the PowerBI.com
- Create a new Streaming dataset

- Push
data set by choosing API and click NEXT

- Fill the form appropriately
Score (as Number data type)
Tweet Text (as Text data type)
Tweet Date (as Date data type)
User (as Text data type)
Toggle On for Historical data analysis
- Data set is created as Power BI Streaming Dataset.

- Under
Data Sets you will see the Streaming Tweets data sets.

- Table and drag fields as
Tweet Date
Tweet Text
User
Score
Format the table

- Drag
Area Chart
>> Drag Tweet Date field onto Axis property. Score field onto Values property and rather than SUM, we will use Average
- Drop 2 Card Visuals
1st card visual: Average Score onto Fields property
2nd card visual: Count of Tweet Text
- Save
report as Streaming Tweets

- Create
a new Dashboard.


STEP 2: Use the Twitter template with Power Automate
- This
time we will use a Power Automate template
- Search for Power BI and you will see a Twitter sentiment analysis template

Text Analytics has to be configured that we will do in next step


STEP 3: Provision Azure Text Analytics
We
need to create a new connection in Azure
to leverage Text Analytics.
-
portal.azure.com, search or make Cognitive Services as favorite

-
Type
Text Analytics


- Create
a Text Analytics Cognitive service

-
Fill the Form

-
Go
to Quick Start under Resource Management, copy the API
endpoint and Key that we will use for Power Automate in the next step.

We need to create a new connection in Azure to leverage Text Analytics.
portal.azure.com, search or make Cognitive Services as favorite

Type
Text Analytics


Fill the Form

Go
to Quick Start under Resource Management, copy the API
endpoint and Key that we will use for Power Automate in the next step.

STEP 4: Complete the Power Automate flow
- Click on Update

- Account Key is from Azure and The site URL is the endpoint.

- And we get this trigger and actions in our Power Automate.

- In trigger we add more hashtag as follows:

- And we will choose only the English language to Detect Sentiment

- Now
we get a payload which we can’t
map. So, we need to delete it.

- We
delete this action and recreate it again. Select the Workspace and Dataset appropriately

- Map
the all Twitter fields in our flow appropriately


- Save
the flow as Streaming Tweets.
- Power Automate is already kicked and run history is showing that is running successfully.

- And
this our live Power BI Real-time Dashboard.


I hope this post helped you.
--Aaroh


