Tuesday, May 12, 2020

How to write Microsoft Exams Online during Covid-19

Hi All,

One of my Microsoft community members asked how to write Microsoft Exams Online many Test centers are closed across the globe.

Here are steps on how we can write a Microsoft exam.


  1. Choose any Microsoft Exam. For e.g., I want to write an exam Exam DP-201: Designing an Azure Data Solution  

  2. Click on the Schedule exam as shown. 


  3. Login into your Microsoft Profile and click on Save and continue. 

  4.  Next page click on Go to Person VUE  as shown.


  5. Select At Home or Office option and then choose your date and time as shown

Here are some first-hand issues that you may want to avoid the Microsoft Online exam: 
  1. Start the logging in 15 minutes early to start the check-in process. 
  2. Must have a stable Internet connection throughout the exam. 
  3. A proctor will be online when you are writing the exam. 
  4. Do not cover your face or whisper throughout the exam. 
  5. Ensure nobody enters your room. 
  6. Remove any family photos, posters in your room where you are writing your exam.  
  7. Close all your apps (Outlook, All Browsers Windows etc.). Proctor may check and might ask you to close all apps. 

    Update Aug 2020
  8. If you have VPN connection, disable it. 
  9. Disable OneDrive, Dropbox  and Google Drive syncs. It sounds strange, but in one of the exams that I wrote recently I had to disable all the OneDrive/Google Drive syncs and I could not proceed with the online exam. Only after disabling the syncs, I was able to write the exam.   

    Update Dec 2020

  10. Ensure you don't have GoToMeeting app installed on your system (Windows Machine). I had a webinar I had to use GoToMeeting but during the exam I was keep getting an error about g2mlauncher.exe is blocking the exam. 

    I had to uninstall the GoToMeeting app and then able to write the exam


Friday, May 1, 2020

4 pillars of Power BI Solutions

Hi All,

On 28 Apr 2020, I spoke on the Power BI SQL PASS community event.

Meetup Event: SG SQL PASS Chapter Meetup - April 2020
Slide Deck and resources (Excel and sample PBIX files) 

There are 4 key pillars of Power BI Solution:


  1. Transform Data

    • Our data will be always raw data that needs to massing for the reports.
    • Data has to into shape and we need to perform a couple of data transformations. 
    • Power BI tries to attempt data types during data transformations. But it may not correct.

  2.  Data Modelling


    • In this phase, we optimizing the tables and columns. 
    • Segmenting common dimensions of your data & build relationships between tables. 
    • Having an effective data model saves so much time
  3. DAX calculations 

    • Formula language that is used in Power BI. 
    • Not only used by PBI but other Microsoft Products. 
    • The primary tool to build Power BI solutions
  4. Report & Visuals

    • This MUST be the last step. You skip the above 3 steps, your BI solutions won't be a success. 
    • More time should be spent on the data model and DAX. 
    • Use appropriate chart / visual for data & STORY you are telling 
    • Key Information STAND OUT
    • Clear & simple title / headings.
    • Understand within 15-20 seconds
  
In this blog post, we will see how to use a sample excel file which can be treated as RAW DATA which as follows data

  1. Sales  - Fact Table
    • It is a transactional table with 7000+ rows.  
    • It has columns such as OrderNumber, OrderDate, Customer Information, Currency, Delivery Information, etc.


  2. US Region  - Lookup Table
    • Information about all US regions
  3. Customer List  - Lookup Table

    • Information about all customer and Distribution channel.

  4. Product List  - Lookup Table
    • Information about Products

Customer requirements from this report

  1. KPIs for
    • Total Sales. 
    • The number of units sold 
    • The number unique Order. 
    • Average Sales per day
  2.  Charts about
    • Sales by the Distribution Channel 
    • Sales by the Warehouse code
    • Sales by Region 
    • Sales bu date
  3. Country Map 
    • Sales by regions 
 
We use this Excel file and open Power BI. 


Follow the video where I have how to perform data clean up and data model. 


I will show the DAX and Visual in this blogpost. 

  • Create a simple textbox  Reporting canvas


  • We create a table to store all our DAX formulas. Select Enter Data in the Report 

  • Name this Empty Table as Key Measure


  • In this empty table create  a new measure


  • Name this 1st measure as Sales 
    Sales = SUM( Sales[LineTotal] )


  • We have created the Date table that I have explained in my video.
  •  Drag the Date table.


  • Change from Date Hierarchy 
     

  • Change to Matrix Visual 


  • Drag the Sales in Power BI Desktop


  • Change Visual to Stacked Column Chart. 


  • Drag the Sales Measure and convert it into card visual.


  •  Drag DistributionChannel from consumer list.

  • in our Data model, we have a relationship with the Sales and Consumer table. 
    We can still get DistributionChannel as it is part of the relationship.

  • Drag Sales Measure in this table.

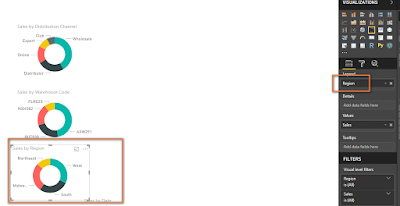
  • Convert to visual to a donut chart.

  • Copy paste this visual twice. It really quickens the report development.

  • 2nd donut chart drag Warehouse code

  • 3rd donut chart drag Region code


  • Drag Map visual and Name field from US Region


    DAX Calculations


  • Create a 2nd measure called Unit Sold. 

    Units Sold = SUM(Sales[OrderQuantity])


    Make it as a Card Visual

  • Copy paste that card visual twice
  • Create 3rd measure called Unique Order

    Unique Order = COUNTROWS(Sales)


    The numbers will change when you any visuals.

  • Create the last and 4th measure called Average Sales Per Day

    Average Sales Per Day = AVERAGEX('Date', [Sales])
  • Adding Year's slicers.


    Add Year slicer. 


I hope you enjoyed this blog-post. 

--aaroh 


Low Code Reimagined with AI + Copilot Pitch Deck - Copy Copilot day (Virtual) - 2023

 Hi All,  I presneded a session at Pune UG on Low Code Reimagined with AI + Copilot Pitch Deck.  Video is at this address  https://www.youtu...