Using
Microsoft flow and Power Automate we can easily use Power BI Real-time data
sets. What is required is as follows:
1. An Office 365 free 30-days trial or subscription.
2. Microsoft Flow
3. Microsoft Flow
4. Power BI Free or Pro edition.
What
is our Business scenario?
Contoso Inc
wants to hold an event and sends 1000 participants a simple digital survey.
They ask about 3 questions i. What Microsoft TECHNOLOGY they are interested in,
the number of years of EXPERIENCE they have in that technology and the LOCATION
they are from.
Contoso wants REAL-TIME dashboard whenever any participant submits the survey. Specifically, Contoso wants the COUNTRY they are from, and participants their number of EXPERIENCE.
Contoso wants REAL-TIME dashboard whenever any participant submits the survey. Specifically, Contoso wants the COUNTRY they are from, and participants their number of EXPERIENCE.
The technology we can use to achieve this requirement
We can use MICROSOFT
FORM to capture digital form. The Microsoft Flow which will process our questions
in the Microsoft flow. Next, we can use
set up Power BI Push dataset and use Power Visuals to achieve this.
This is a sample of our Microsoft Form
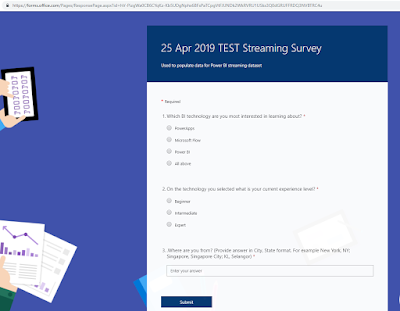
This is a sample of our Microsoft Form

Step1: Start Microsoft Flow
- Microsoft Flow has many templates that we can leverage.

for our case, we will create Flow from scratch - Create
from blank

- Click on Create from blank

- We will choose Microsoft Forms as our Trigger in the Flow.

- It will limit me the number of actions and trigger which are available to our disposal.
- We
have only ONE trigger which is nice. Click on “When a new response is submitted”.

- As
I have single sign-on turned on, I will be presented with Form ID. Choose the Form which I have created

- Next,
click on New step

- It
is storing all the information as an array
within Flow. When a person
submits the form, it will be a trigger. So, if Alex submits the 3 questions in the
survey, Flow will process all the 3 questions in the “Get response details” action.

- Select
the Form which we created in the previous step and in the “Response Id”, under the Dynamic content select the List of response notifications Response Id

- Now
it has created some new elements and each response is wrapped by for each loop.

Step 2: Streaming Data using Power BI
- Go
to Power BI and created a new app workspace. Name it as 25 Apr 2019 Streaming Data set Demo. It won't have any dashboards,
reports, etc.

- This
is the landing page. Click on the Skip

- Click
on Create option and then click on Streaming dataset.

- We
will leverage API and click NEXT

- Now
it has Power BI has a very intuitive user interface (UI) which just enter the values. Types the values as follows
Technology, Experience, and Location.
Toggle ON for Historical data analysis
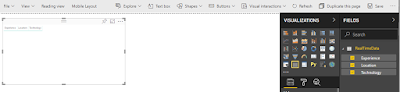
- A new dataset has been created.

- It
has the same look and feel just like your Power
BI Desktop.

- Firstly,
we will create a table visual here.

- Drag
all the fields to the table.
- Bump
the column headers and Value size.


- Make alternate rows in Style property

- Turn
off Total

- Drag
the MAP visual and alight towards the top
right.

- Drag
Location field onto the Location property of the map.

- Drag
the Technology field onto the Legend property of the map.

- And
finally, drag Experience field onto Size property of the map.

- The last chart is stacked column chart
and drags it to report canvas.

- Drag
Technology onto Axis property, Experience
onto Legend property and Experience onto Size property.

- Save the report as 25
Apr 2019 Survey Response

- Next,
pin the visuals individually to Dashboard

- Do the same for TWO more visuals.
- Now,
our Dashboard is ready.

- Note
that Streaming and Pubnub works only for custom streaming data as shown.

and we can’t use ANY of the visual that we are doing for this exampleStep 3: Complete the Flow
- Click
on Add an action in Flow just below the When a new response is a submitted trigger

- Next,
Add rows to a data action

- Choose
appropriate workspace

- Select
the Dataset

- The table will be RealTimeData.
- Next,
Flow dynamically shows the Forms
data fields.

- From
Technology data field, choose the
appropriate item from MS Forms.

- Select
other Form fields as shown:

- Click
on SAVE button on the Flow and you
will see the Run History when people
are submitting the MS form data.

Step 4: View the Power BI Dashboard
- Dashboard display real-time
data when anyone submits a form

- The report can be refreshed by using a Schedule.

Hope you find this blog post useful


--Aroh Shukla


No comments:
Post a Comment