After working in the SharePoint domain for a couple of years as SharePoint consultant , I am fortunate enough to help customers from many verticals such as education, utilities, banking, and Government sectors.
A common thing which showed me why SharePoint projects (in general ,all the non-projects) get delayed are as follows:
- No proper requirement analysis from the key stakeholders as a partner. When project starts and new requirements come within the project which were not factored in the initial project plan. This resulted in change requests and depending on the change the timeline gets shifted.
- No foresight in the SharePoint’s capacity planning in terms of SharePoint On-Premises environment. Please read my earlier blog about why SharePoint is slow for more details.
- None or very limited SharePoint Governance.
It’s not a new buzzword but SharePoint
governance has become far more critical in SharePoint
Online environment.
In most of organization’s I have had worked, they have a little or no governance at all. SharePoint Governance Plan is most the important success factor.
When a SharePoint platform is given to end users, it starts out easy. However, they keep adding more content with no information architecture in place, it gets complicated. The concepts of term store, management metadata services, search service, user profile service could be new for end users and educating them is important.
In a nutshell, SharePoint Governance includes:
- Information Management (Site planning, Navigation, Management metadata, search etc.
- Application Management (Customization policy, Solutions, 3rd Party)
- Communication and training (communication plan, training plan, support plan)
- Roles and Responsibilities (Team definition and responsibilities)
Please refer to this excellent blog about SharePoint Governance.
Without governance it would be like a city without any authority roles and guideline as illustrated below:

I created Server Object model to achieve this in my blog.
Furthermore, we had to give site access report via PowerShell who accessed the SharePoint site monthly in manual way.
Now, if they had 30 site collections and number of folders of each site collection the effort would be much more.
In the SharePoint Online context, it would be much more complicated as we have any access to SharePoint app model to manipulate the folder size using CSOM and REST.
Sharegate is one of the best tools that I have come across for this very purpose. It has in built reports permissions report which graphically shows which use has what permissions matrix for sites (or OneDrive), site collection with basic details, external users and many more.
In new version of Sharegate, you can easily schedule tasks every day, every week, every month etc. which makes SharePoint administrator’s job much more simpler without PowerShell.

In this blog post, I will detail steps to
generate SharePoint administrative reports using Sharegate and display this
report on the SharePoint Online site.

Step2: Select the sites to be included in the report and click on “Run” button.

Step3: Verify the results and click on Export button.


Step5: Microsoft has given us a FREE business intelligence tool called Power BI. Download to your desktop as client.


Step7: In
the Navigator, the results page has
to be adjusted for Size and Date. Click on the Edit button.

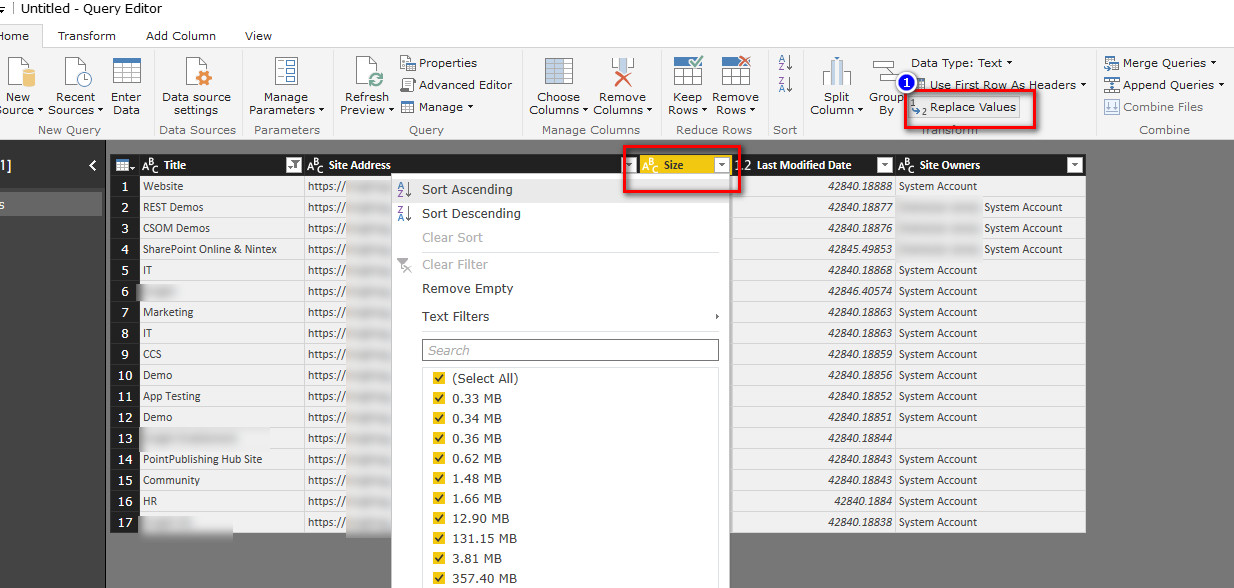
Step8: In
the Title column, remove blank rows, in the Size column, click on the “Replace
Values” option and Replace value MB
to blank as shown:

Step9: Do
the same process for the “Last Modified
Date”, select the Data Type, Date
field.

Step10: Click on the Close and Apply,


The Power BI report is saved as .pbix format

Step11:
Now, on right side of Power BI client, we can see Visualizations and Fields that we selected in above steps. Select the Multi-row card visualization pane

Results pane, select the Title as shown:

Step12:
Click on the Pie Chart in Visualization
pane

Step13: Select
Title field from Results pane and drag to Details in the Visualization pane as shown:

Step14: Select
Size field from Results pane and drag to Values
in the Visualization pane as shown:

Step15:
We get a dynamic SharePoint report for the size
for ALL the site collections we choose from
Power BI.

We can change the view to display from information from the graph as follows:

Furthermore, we can also drill down to each site and view the details:

Publish this report to SharePoint Online.
Step16:
We need to active Power BI app on SharePoint Online. Follows these steps:
Sign
up to leverage Power BI


After few seconds, we have Power BI app
activated in our SharePoint Online environment.

Go back to locate the file that we just created
in Power BI a few minutes back.


and our report available on Power BI at
SharePoint Online.
Step17: File >> Publish to Web

Next, get the “Create embed code”

Click in “Publish”
button.

Embedded code is available in Power BI

Step18: On
SharePoint Online Site, Edit the
Wiki page, and insert the Embed
code.

A preview will be displayed.

Close and Save the page. Our report is now available.

I hope this blog post helped you and please comment
if it is useful.
References:
- What is a SharePoint Governance?
- Start Building a SharePoint Governance Plan in the Real World
- Get started with Power BI service


